1. Executive Summary
The quantms.io format is a modern, scalable data format designed specifically for proteomics data analysis. It addresses the limitations of existing formats like XML-based HUPO-PSI standards (mzML, mzIdentML) and tab-delimited formats like mzTab, which struggle with large-scale datasets and advanced analytical use cases.
1.1. Key Benefits
-
Performance: Leverages columnar storage (Apache Parquet) to achieve significant improvements in storage efficiency (up to 70% reduction) and query performance.
-
Scalability: Designed to handle large-scale proteomics datasets with efficient slicing and partitioning capabilities.
-
Flexibility: Supports multiple "views" of proteomics data (PSMs, features, proteins) that can be serialized in different formats.
-
AI/ML Ready: Structured to facilitate machine learning applications with standardized representation of spectra, identifications, and quantifications.
-
Integration: Enables seamless integration with sample metadata and other omics data types.
1.2. Core Components
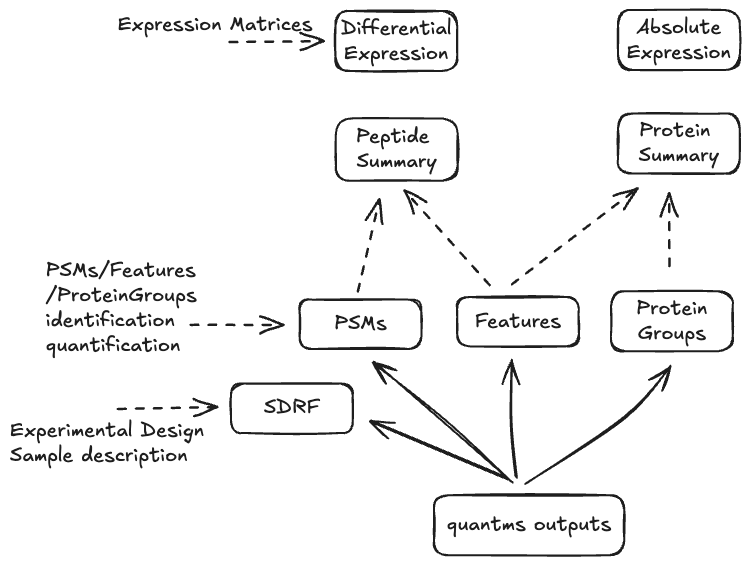
The format consists of several interconnected views:
-
Identification Views: PSM (Peptide Spectrum Matches), peptide features, and protein groups
-
Quantification Views: Absolute and differential expression matrices
-
Metadata Views: Project information and sample metadata (SDRF)
-
Spectra View: Mass spectra data optimized for efficient storage and retrieval
Each view can be serialized in appropriate formats (Parquet for complex data, TSV for matrices, JSON for metadata), creating a comprehensive ecosystem for proteomics data representation.
1.3. Current Status
The quantms.io format is currently at version 1.0 and is primarily implemented in the quantms workflow. It has been successfully applied to various proteomics datasets, demonstrating significant improvements in storage efficiency and analysis capabilities compared to traditional formats.
|
ℹ️
|
We are not trying to do the following:
|
2. Introduction
The majority of formats in HUPO-PSI are based on XML format including mzML, mzIdentML making difficult to use them for large-scale, AI model technologies. Also, the previous approach to move away from XML-based approaches, mzTab "falls short" to produce a tab-delimited format that can scale with the size of the data. Here, we aim to formalize and develop a more standardized format that enables better representation of the identification and quantification results but also enables new and novel use cases for proteomics data analysis. The main use cases for the format are:
-
Fast and easy visualization of the identification and quantification results.
-
Easy integration with other omics data.
-
Easy integration with sample metadata.
-
AI/ML model development based on identification and quantification results.
-
Easy data retrieval for big datasets and large-scale collections of proteomics data.
|
ℹ️
|
We are not trying to do the following:
|
3. General data model and structure
The quantms.io (.qms) could be seen as a multiple view representation of a proteomics data analysis results. Similar to other tools that produce multiple output files for their analysis, like MaxQuant, DIA-NN, FragPipe or spectronaut. Each view of the format can be serialized in different formats depending on the use case. The data model defines two main things, the view and how the view is serialized. Both views and serialization can be extended, and new views can be added on each Chapter 7 of the specification.
-
The data model view defines the structure, the fields and properties that will be included in a view for each peptide, psms, feature or protein.
-
The data serialization defines the format in which the view will be serialized and what features of serialization will be supported, for example, compression, indexing, or slicing.
view |
file class |
serialization format |
definition |
mz |
mz_file |
parquet |
|
psm |
psm_file |
parquet |
|
feature |
feature_file |
parquet |
|
pg |
pg_file |
parquet |
|
peptide |
peptide_file |
parquet |
|
protein |
protein_file |
parquet |
|
absolute |
absolute_file |
tsv |
|
differential |
differential_file |
tsv |
|
sdrf |
sdrf_file |
tsv |
|
project |
- |
json |
|
ℹ️
|
Some of these data models fit better for some analytical methods than others, for example, the psm view Section 14.1 is more suitable for data-dependent acquisition (DDA) methods, and may not be present in data-independent acquisition (DIA) methods; while the feature view Section 14.2 could be generated in both DDA and DIA methods. Different expression view Chapter 13 are only present in those experiments while absolute-expression (based on IBAQ values) is only available on datasets where comparisons are not performed between conditions. |
The .qms contains all the files of a quantms.io experiment. It will contain metadata files and different views of the experiments; Chapter 3.
4. Common data structures and formats
We have some concepts that are common for some outputs and would be good to define and explain them here:
4.1. Peptidoform
A peptidoform is a peptide sequence with modifications. For example, the peptide sequence PEPTIDM with a modification of Oxidation would be PEPTIDM[Oxidation]. The peptidoform show be written using the Proforma specification. This concept is used in the following outputs:
4.2. Modifications
A modification is a chemical change in the peptide sequence. Modifications can be annotated in multiple ways in quantms.io format:
-
As part of the Proforma notation inside the peptide sequence:
-
Example:
PEPT[Oxidation]IDE[Phospho] -
Uses modification name or accession (e.g.,
OxidationorUNIMOD:35) -
RECOMMENDED to use UNIMOD accessions
-
For non-UNIMOD modifications, use CHEMMOD format:
CHEMMOD:-18.0913(mass shift in Daltons)
-
-
As a structured representation with position-specific scores:
{
  "name": "Oxidation",
  "accession": "UNIMOD:35",
  "positions": [
    {
      "position": "M.4",      // Format: {AA}.{position}
      "scores": [
        {
          "score_name": "localization_probability",
          "score_value": 0.99  // Float value
        }
      ]
    }
  ]
}
Position Format:
- Amino acid modifications: {AA}.{position} (e.g., "M.4" for Met at position 4)
- N-terminal modifications: "N-term.0"
- C-terminal modifications: "C-term.{length+1}"
Scores are associated with specific positions, allowing for: - Localization probabilities - Position-specific confidence scores - Other position-dependent metrics
|
ℹ️
|
|
4.3. Scan (scan number)
Scan number (scan) aims to point to the MS/MS in a Raw, mzML, or peak list file (e.g., MGF). mzIdentML, mzTab, USI, and another HUPO-PSI standardization have different ways to use and define scan number. Here we will use the latest definition from USI. A single scan point to an MS/MS in the spectra file. The scan is a unique identifier, and it could be a number or a string depending on the instrument.
-
AB Sciex:
sample=1 period=1 cycle=2740 experiment=10→1,1,2740,10. In this scenario, where reference to the original scan event is desired but a single scan number is not sufficient, then we usenativeIdmechanism. -
Waters nativeId:
function=10 process=1 scan=345→10,1,345 -
Bruker nativeId:
frame=120 scan=475→120,475 -
Thermo scan :
controllerType=0 controllerNumber=1 scan=43920→43920
Note: since the controllerType and controllerNumber are always 0 and 1 for mass spectra. In rare cases, if either controllerType is not 0 or controllerNumber is not 1 (e.g., a PDA spectrum is being referenced), then the nativeId form MUST be used: controllerType=5 controllerNumber=1 scan=7 → 5,1,7
The scan is use in the following section: Section 14.1, Section 14.2, Chapter 17.
|
ℹ️
|
Normally the scan value is only captured in the column, while the format of the scan: |
4.4. Identification scores
Every workflow within quantms uses different identification/quantification scores to determinate the quality of the identification or the quantification. additional_scores in quantms try to capture multiple scores from different workflows such as the Comet:xcorr or DIA-NN:Q.Value. Additional scores are stored as a key/value pair where the key is the name of the score (is RECOMMENDED to use HUPO-PSI MS ontology) and the value is the score value. This concept is used in the following outputs:
-
[Comet:xcorr:67.8", DIA-NN:Q.Value:0.01]
This concept is used in the following outputs:
4.5. Controlled vocabulary terms
The following views Section 14.1, Section 14.2, Chapter 17 use controlled vocabularies to describe the data. The controlled vocabulary terms are used to standardize the data and make it easier to integrate with other datasets. The controlled vocabulary terms are stored as a key/value pair where the key is the name of the controlled vocabulary term and the value is the term value. This concept is used in the following outputs:
-
["ms level": "2", "deconvoluted data": null]
The name/key of the controlled vocabulary MUST be provided; the value is optional.
5. Serialization formats
The quantms.io format has different serialization formats for each view. The serialization format defines how the view will be serialized and what features of serialization will be supported, for example, compression, indexing, or slicing. The following serialization formats are supported:
-
tsv: Tab-separated values format.
-
parquet: Apache Parquet format.
-
json: JavaScript Object Notation format.
5.1. Parquet format
Parquet is a columnar storage format that supports nested data. Apache Parquet is an open-source format designed for efficient data storage and retrieval. It offers high-performance compression and encoding schemes, making it well-suited for handling large volumes of complex data. Parquet is widely supported across various programming languages and analytics tools.
Apache Parquet includes two types of metadata: file metadata and column metadata. File metadata contains pointers to the starting locations of all the column metadata, while column metadata holds location information for the individual column chunks. Readers first access the file metadata to find the column chunks they need, then use the column metadata to efficiently skip over irrelevant pages.
A Parquet table can be distributed across multiple compute nodes, and its key advantage is that applications can quickly jump to the relevant fields in a record using metadata. For large-scale analyses, Parquet has helped users reduce storage requirements by at least one-third on large datasets. Additionally, it significantly improves scan and deserialization times (important for web-based use cases), thus reducing overall costs.
| Project | Type | Original file size(GB) | Converted parquet size(MB) | Writing psm time(s) | Writing feature time(s) |
|---|---|---|---|---|---|
PXD046440 |
maxquant |
48 |
337/343 |
985.2671835 |
678.474133 |
PXD016999 |
mzTab |
160 |
155/228 |
539.0019641 |
3554.52738 |
PXD019909 |
diaNN |
1.9 |
195 |
229.482332 |
5.1.1. Parquet features
-
Columnar Storage: Parquet’s columnar design improves compression and query performance by storing data by columns rather than rows, which reduces I/O for analytical queries that typically access only a few columns.
-
Efficient Compression: The format achieves better compression ratios with algorithms like Snappy, Gzip, and LZO, and uses techniques like RLE, and dictionary encoding for further optimization.
-
Schema Evolution: Parquet supports adding, deleting, or modifying columns without affecting existing data, making it adaptable to schema changes.
-
Complex Data Types: Supports nested structures and data types like arrays, maps, and structs, allowing efficient storage of complex data.
5.1.2. Parquet slicing
quantms.io supports slicing parquet files using any field when generating them.Upon storage, the files are organized into distinct folders according to the chosen slicing fields.
PXD004683/
│
├── sample_accession_1/
│   ├── file1.parquet
│   └── file2.parquet
│
├── sample_accession_2/
│   ├── file3.parquet
│   └── file4.parquet
│
└── sample_accession_3/
    ├── file5.parquet
    └── file6.parquet
...
When registering parquet files to project.json Chapter 9, it will be in such a format.
  "quantms_files": [
    {
      "feature_file": [
        {
          "path_name": "PXD004683",
          "is_folder": true,
          "partition_fields": ["sample_accession"]
        }
      ]
    },
  ]
6. File extensions
File extensions are used to identify the file type. In quantms.io the extensions are constructed as follows: *.{view}.{format} where the view is one of the well-defined views in the specification and the format is one of the serialization formats. For example:
-
An absolute expression file:
PXD000000-943a8f02-0527-4528-b1a3-b96de99ebe75.absolute.tsv -
A differential expression file:
PXD000000-943a8f02-0527-4528-b1a3-b96de99ebe75.differential.tsv -
A feature file:
PXD000000-943a8f02-0527-4528-b1a3-b96de99ebe75.feature.parquet -
A psm file:
PXD000000-943a8f02-0527-4528-b1a3-b96de99ebe75.psm.parquet
|
ℹ️
|
In quantms.io we use the UUID to identify the project and the files {PREFIX}-{UUID}.{view}.{format}, it is optional, but for most of the code examples we will use it. uuids: A Universally Unique Identifier (UUID) URN Namespace, as defined in RFC 4122, provides a standardized method for generating globally unique identifiers across various systems and applications. The UUID URN Namespace ensures that each generated UUID is highly unlikely to collide with any other UUID, even when produced by different entities and systems.
|
7. Versioning
The structure of the version is as follows {major release}.{minor update}: The current quantms.io specification version is: 1.0
-
All views (Section 14.1, Section 14.2, Section 15.1) and serialization formats will have a version number in the way:
quantmsio_version: {}. This will help to identify the version of the specification used to generate the file. -
Major release changes will be backward incompatible, while minor updates will be backward compatible.
8. Software provider
The data within quantms.io is mainly generated from quantms workflow. However, the format is open and can be used by any software provider that wants to generate the data in this format. The software provider and the version of the software used to generate the data will be stored in the project view Chapter 9 as:
"software_provider": {
    "name": "quantms",
    "version": "1.3.0"
  }
9. Project quantms.io
The project view is the file that stores the metadata of the entire quantms.io project. The project view is a JSON file that contains the following fields:
9.1. Project fields
Field |
Description |
Type |
|
Project accession identifier |
string |
|
Title of the project |
string |
|
Description of the project |
string |
|
Description of the project sample |
string |
|
Description of the project data |
string |
|
PubMed ID associated with the project |
int32 |
|
List of Organisms involved in the project |
list[string], null |
|
Parts of Organisms studied |
list[string], null |
|
Diseases associated with the study |
list[string], null |
|
Cell lines used in the study |
list[string], null |
|
Instruments used for data acquisition |
list[string] |
|
Enzymes used in the study |
list[string] |
|
Types of experiments conducted |
list[string] |
|
Properties of the data acquisition methods |
list[key/value] |
|
Files related to quantMS analysis |
list[key/value] |
|
Version of the |
string |
|
The Chapter 8 used to generate the data |
key/value |
|
Additional comments or notes |
list[string] |
-
key/value pair object: The key/value pairs are used to store the acquisition properties, and the quantms files.
Example of acquisition_properties:
   "acquisition_properties": [
        {"precursor tolerance": "0.05 Da"},
        {"dissociation method": "HCD"}
   ]
9.2. Project files
The files within a project are in the current version Chapter 7 optional. Files within a project should be listed in the quantms_files, for every file the following information is necessary:
-
path_name: The name of the file or folder.
-
is_folder: A boolean value that indicates if the file is a folder or not.
-
partition_fields: The fields that are used to partition the data in the file. This is used to optimize the data retrieval and filtering of the data. This field is optional.
|
ℹ️
|
Parquet files can be storage as folders when the data is partitioned by some fields. For example, a parquet file that is partitioned by the sample_accession field will be stored as a folder with the name of the field and the value of the field.
|
Example of quantms_files:
   {
  "quantms_files": [
    {
      "psm_file": [
        {
          "path_name": "PXD004683-550e8400-e29b-41d4.1.psm.parquet",
          "is_folder": false
        },
        {
          "path_name": "PXD004683-550e8400-e29b-41d4.2.psm.parquet",
          "is_folder": false
        }
      ]
    },
    {
      "feature_file": [
        {
          "path_name": "PXD004683",
          "is_folder": true,
          "partition_fields": ["sample_accession"]
        }
      ]
    },
    {
      "differential_file": [
        {
          "path_name": "PXD004683-a716.differential.tsv",
          "is_folder": false
        }
      ]
    },
    {
      "absolute_file": [
        {
          "path_name": "PXD004683-e29b-41f4-a716.absolute.tsv",
          "is_folder": false
        }
      ]
    },
    {
      "sdrf_file": [
        {
          "path_name": "PXD004683-e29b-41f4-a716.sdrf.tsv",
          "is_folder": false
        }
      ]
    }
  ]
}
Example:
   {
    "project_accession": "PXD014414",
    "project_title": "",
    "project_sample_description": "",
    "project_data_description": "",
    "project_pubmed_id": 32265444,
    "organisms": [
        "Homo sapiens"
    ],
    "organism_parts": [
        "mammary gland",
        "adjacent normal tissue"
    ],
    "diseases": [
        "metaplastic breast carcinomas",
        "Triple-negative breast cancer",
        "Normal",
        "not applicable"
    ],
    "cell_lines": [
        "not applicable"
    ],
    "instruments": [
        "Orbitrap Fusion"
    ],
    "enzymes": [
        "Trypsin"
    ],
    "experiment_type": [
        "Triple-negative breast cancer",
        "Wisp3",
        "Tandem mass tag (tmt) labeling",
        "Ccn6",
        "Metaplastic breast carcinoma",
        "Precision therapy",
        "Lc-ms/ms shotgun proteomics"
    ],
    "acquisition_properties": [
        {"proteomics data acquisition method": "TMT"},
        {"proteomics data acquisition method": "Data-dependent acquisition"},
        {"dissociation method": "HCD"},
        {"precursor mass tolerance": "20 ppm"},
        {"fragment mass tolerance": "0.6 Da"}
    ],
    "quantms_files": [
      {
        "feature_file": [
          {
            "path_name": "PXD014414.feature.parquet",
            "is_folder": false
          }
        ]
      },
      {
        "sdrf_file": [
          {
            "path_name": "PXD014414.sdrf.tsv",
            "is_folder": false
          }
        ]
      },
      {
        "psm_file": [
          {
            "path_name": "PXD014414-f4fb88f6.psm.parquet",
            "is_folder": false
          }
        ]
      },
      {
        "differential_file": [
          {
            "path_name": "PXD014414-3026e5d5.differential.tsv",
            "is_folder": false
          }
        ]
      }
    ],
    "software_provider": {
       "name": "quantms",
       "version": "1.3.0"
    },
    "quantmsio_version": "1.0",
    "comments": []
   }
10. SDRF view
The Proteomics Sample and Data Relationship Format (SDRF) is a tab-delimited file format that describes the relationship between samples, data files, and the experimental factors. The SDRF is a key file in the proteomics data analysis workflow as it describes the relationship between the samples and the data files. The specification of the SDRF can be found in the SDRF GitHub repository.
11. Absolute quantification view
Absolute quantification is the process of determining the absolute/baseline amount of a target protein in a sample. In proteomics, the main computational method to determine the absolute quantification is the intensity-based absolute quantification (iBAQ) method.
11.1. Absolute quantification use cases
-
Fast and easy visualization absolute expression (AE) results using iBAQ values.
-
Store the AE results of each protein on each sample.
-
It could be used as a proxy to understand the expression profile of a protein in different conditions, tissues and organisms.
11.2. Format
The absolute expression format is a tab-delimited file format that contains the following fields:
-
protein→ Protein accession or semicolon-separated list of accessions for indistinguishable groups -
sample_accession→ Sample accession in the SDRF. -
condition→ Condition name -
ibaq→ iBAQ value -
ibaq_normalized→ Relative iBAQ value, Ibaq value normalized by the sum of the iBAQ values in the sample.
Example:
protein |
sample_accession |
condition |
ibaq |
ibaq_normalized |
LV861_HUMAN |
Sample-1 |
heart |
1234.1 |
12.34 |
11.2.1. AE header
We based the AE format (Chapter 11) and DE (Chapter 13) based on MSstats and other genomics formats such as VCF. By default, the MSstats format does not have any header of metadata. We suggest adding a header to the output for better understanding of the file. By default, MSstats allows comments in the file if the line starts with #. The quantms output will start with some key value pairs that describe the project, the workflow and also the columns in the file. For
Example:
#project_accession=PXD000000
In addition, for each Default column of the matrix the following information should be added:
#INFO=<ID=protein, Number=inf, Type=String, Description="Protein Accession">
#INFO=<ID=sample_accession, Number=1, Type=String, Description="Sample Accession in the SDRF">
#INFO=<ID=condition, Number=1, Type=String, Description="Value of the factor value">
#INFO=<ID=ibaq, Number=1, Type=Float, Description="Intensity based absolute quantification">
#INFO=<ID=ibaq_normalized, Number=1, Type=Float, Description="normalized iBAQ">
-
The
IDis the column name in the matrix, theNumberis the number of values in the column (separated by;), theTypeis the type of the values in the column and theDescriptionis a description of the column. The number of values in the column can go from 1 toinf(infinity). -
Protein groups are written as a list of protein accessions separated by
;(e.g.P12345;P12346)
We RECOMMEND including the following properties in the header:
-
project_accession: The project accession in PRIDE Archive -
project_title: The project title in PRIDE Archive -
project_description: The project description in PRIDE Archive -
quantmsio_version: The version of the quantmsio used to generate the file -
factor_value: The factor values used in the analysis (e.g.tissue)
Please check also the differential expression example for more information: Chapter 13
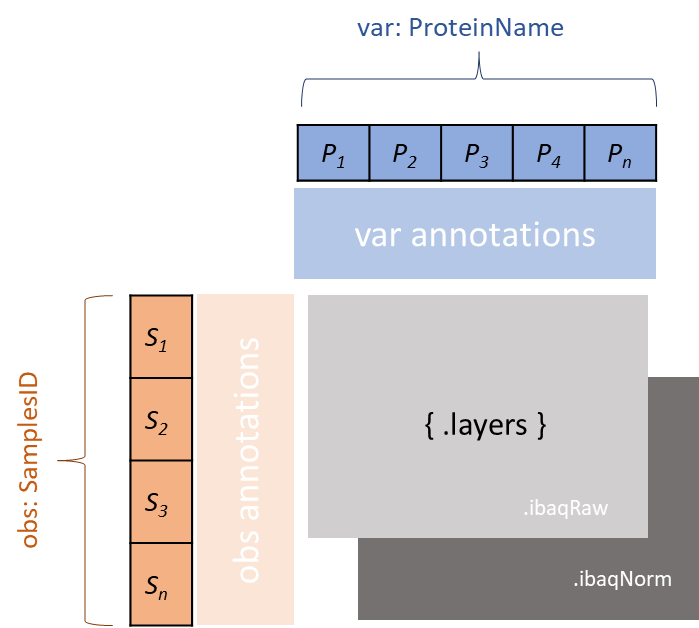
12. AnnData view
The AnnData view is a collection of multiple AE files. Its obs represents the samples, var represents the proteins, and the conditions are stored in obs.
-
Retrieve all the proteins for a given sample.
-
Obtain all samples under the same condition.
13. Differential expression view
The differential expression view is a tab-delimited file format that contains the differential expression results between two contrasts, with the corresponding fold changes and p-values. The differential expression view is a key file in the proteomics data analysis workflow as it describes the differential expression between two conditions.
13.1. Differential expression use cases
-
Store the differential express proteins between two contrasts, with the corresponding fold changes and p-values.
-
Enable easy visualization using tools like Volcano Plots.
-
Enable easy integration with other omics data resources.
-
Store metadata information about the project, the workflow and the columns in the file.
13.2. Format
The differential expression format by quantms.io is based on the MSstats output:
-
protein→ Protein Accession -
label→ Label for the contrast on which the fold changes and p-values are based on -
log2fc→ Log2 Fold Change -
se→ Standard error of the log2 fold change -
df→ Degree of freedom of the t-student test -
pvalue→ Raw p-values -
adj_pvalue→ P-values adjusted among all the proteins in the specific comparison using the approach by Benjamini and Hochberg -
issue→ Issue column shows if there is any issue for inference in corresponding protein and comparison, for example, OneConditionMissing or CompleteMissing.
Example:
protein |
label |
log2fc |
se |
df |
pvalue |
adj_pvalue |
issue |
ADA2_HUMAN |
normal - squamous cell carcinoma |
0.3057 |
0.26 |
37 |
0.02 |
0.43 |
13.2.1. DE header
By default, the MSstats format does not have any header of metadata. We suggest adding a header to the output for better understanding of the file. By default, MSstats allows comments in the file if the line starts with #. The quantms output will start with some key value pairs that describe the project, the workflow and also the columns in the file. For example:
#project_accession=PXD000000
In addition, for each Default column of the matrix the following information should be added:
#INFO=<ID=protein, Number=inf, Type=String, Description="Protein Accession">
#INFO=<ID=label, Number=1, Type=String, Description="Label for the Conditions combination">
#INFO=<ID=log2fc, Number=1, Type=Double, Description="Log2 Fold Change">
#INFO=<ID=se, Number=1, Type=Double, Description="Standard error of the log2 fold change">
#INFO=<ID=df, Number=1, Type=Integer, Description="Degree of freedom of the Student test">
#INFO=<ID=pvalue, Number=1, Type=Double, Description="Raw p-values">
#INFO=<ID=adj_pvalue, Number=1, Type=Double, Description="P-values adjusted among all the proteins in the specific comparison using the approach by Benjamini and Hochberg">
#INFO=<ID=issue, Number=1, Type=String, Description="Issue column shows if there is any issue for inference in corresponding protein and comparison">
-
The
IDis the column name in the matrix, theNumberis the number of values in the column (separated by;), theTypeis the type of the values in the column and theDescriptionis a description of the column. The number of values in the column can go from 1 toinf(infinity). -
Protein groups are written as a list of protein accessions separated by
;(e.g.P12345;P12346`)
We suggest including the following properties in the header:
-
project_accession: The project accession in PRIDE Archive -
project_title: The project title in PRIDE Archive -
project_description: The project description in PRIDE Archive -
quantmsio_version: The version of the quantmsio used to generate the file. -
factor_value: The factor values used in the analysis (e.g.phenotype) -
adj_pvalue: The FDR threshold used to filter the protein lists (e.g.adj_pvalue < 0.05)
14. Peptide-based Views: psm, feature and peptide
Multiple peptide-level views are available for the quantms.io format. The views are the following:
-
Section 14.1: Peptide Spectrum Match (psm) View—The psm view aims to cover detail on Peptide spectrum matches (psm) level for AI/ML training and other use-cases, mainly for DDA analytical methods.
-
Section 14.2: Peptide Feature View—The peptide feature views (peptide features) aims to cover detail on quantified peptide information level, including peptide intensity in relation to the sample metadata.
-
Section 14.3: Peptide View—The peptide view is a summary of quantified peptides by samples, the aim of this representation is to provide a simple summary of the number of peptides and their given quantity for each protein on each sample. This view is useful for quick visualization and data retrieval.
14.1. Peptide spectrum match (psm) view
Peptide spectrum matches (psms) are the results of the identification of peptides in mass spectrometry data. PSMs are mainly the results of peptide identification by database search engines on data-dependent acquisition (DDA) experiments.
14.1.1. Psm use cases
-
The psm table aims to cover detail on psm level for AI/ML use-cases.
-
Most of the content is similar to mzTab, a psm would a peptide identification in a msrun file.
-
We included in the psm view the spectrum information as optional for those use cases that want to have fast access to peptide information + spectrum data, for example, clustering or intensity prediction
-
Fast and easy visualization of PSM information.
14.1.2. PSM fields
The following table presents all the fields and attributes for each PSM (Peptide Spectrum Match) entry in the psm_file. Some fields are shared between the Section 14.1, Section 14.2 and Section 14.3 views.
For reference, we’ve included the corresponding field names in common proteomics tools:
-
MaxQuant: Fields from msms.txt
-
FragPipe: Fields from psm.tsv
-
DIA-NN: Fields from report.tsv
-
mzTab: Fields from PSM section
| Field | Description | Type | DIA-NN | FragPipe | MaxQuant | mzTab |
|---|---|---|---|---|---|---|
Core Identification Fields (shared with features and peptides) |
||||||
|
Unmodified peptide sequence (amino acid sequence only) |
string |
Stripped.Sequence |
Peptide |
Sequence |
sequence |
|
Complete peptide sequence with modifications in ProForma notation (see Section 4.1) |
string |
Modified.Sequence |
Modified Peptide |
Modified sequence |
opt_global_cv_MS:1000889_peptidoform_sequence |
|
Structured representation of modifications including name, position, and localization probability (see Section 4.2) |
array[struct], null |
- |
- |
- |
- |
|
Charge state of the precursor ion |
int32 |
Precursor.Charge |
- |
Charge |
charge |
|
Posterior error probability (PEP) for the given peptide or psm match. |
float32, null |
PEP |
- |
PEP |
opt_global_Posterior_Error_Probability_score |
|
Decoy indicator, 1 if the peptide is a decoy, 0 target |
int32 |
- |
- |
Reverse |
opt_global_cv_MS:1002217_decoy_peptide |
|
Theoretical peptide mass-to-charge ratio based on an identified sequence and modifications |
float32 |
- |
Calculated M/Z |
- |
calc_mass_to_charge |
|
Experimental peptide mass-to-charge ratio of identified peptide (in Da) |
float32 |
- |
Observed M/Z |
m/z |
exp_mass_to_charge |
|
MS2 scan’s precursor retention time (in seconds) |
float32, null |
RT |
- |
Retention time |
retention_time |
|
Predicted retention time of the peptide (in seconds) |
float32, null |
Predicted.RT |
- |
- |
- |
|
Spectrum file name with no path information and not including the file extension |
string |
Run |
Spectrum File |
Raw file |
spectra_ref |
|
Scan index (number of nativeId) of the spectrum identified: read Section 4.3 |
string |
Spectrum |
MS/MS scan number |
spectra_ref |
|
|
List of structures, each structure contains two fields: name and value. |
array[struct{name: string, value: float32}] |
DIA-NN Scores |
FragPipe Scores |
MaxQuant Scores |
search_engine_score |
|
Optional list of CV parameters for additional metadata Section 14.1.4 |
array[struct{cv_name:string, cv_value:string}], null |
- |
- |
- |
- |
Protein Mapping Fields |
||||||
|
Protein accessions of all the proteins that the peptide maps to |
array[string], null |
Protein.Ids |
- |
Proteins |
accession |
Spectral Data Fields (optional) |
||||||
|
Ion mobility value for the precursor ion |
float, null |
- |
- |
- |
- |
|
Number of peaks in the spectrum used for the peptide spectrum match |
int32, null |
- |
- |
- |
- |
|
Array of m/z values for the spectrum used for the peptide spectrum match |
array[float], null |
- |
- |
- |
- |
|
Array of intensity values for the spectrum used for the peptide spectrum match |
array[float], null |
- |
- |
- |
- |
14.1.3. Additional scores
Additional scores are stored as a list of key-value pairs, where the key is the name of the score (is RECOMMENDED to use HUPO-PSI MS ontology) and the value is the score value. Additional scores are mainly the search engine and protein scores that want to be added at PSM level. Some RECOMMENDED scores are:
-
pg_global_qvalue: Protein group global q-value used to filter the psm at the level of the protein group and experiment.
-
rank: Rank of the peptide in the search engine results. (1.0)
-
global_qvalue: Global q-value of the PSM at the level of the experiment.
-
Psm view is NOT RECOMMENDED to be generated for DIA methods because it will be duplicated information with the feature view. The psm view is more suitable for DDA methods where the psm is the main output of the identification process.
-
Protein inference SHOULD NOT be included in the psm view, as it is not the main purpose of the psm view. However, for some use cases like peptide filtering, search, etc., maybe interesting to have access to all the psms for a given protein accession, you can include that in the
protein_accessions: protein group accessions. Another two protein-related fields can help the users to understand the resulted psm table,unique(if the peptide only maps to one protein),pg_global_qvalue(protein group q-value) that can be added to theadditional_scoresfield. -
The
mz_arrayandintensity_arrayare arrays of the same length, where themz_arraycontains the m/z values and theintensity_arraycontains the intensity values; and the size of the arrays is the same as the number of peaks in the spectrum. These three columns could help use cases like AI/ML that need the spectrum information for a given psm. We RECOMMEND using for spectra data the mz view (Chapter 17), where the spectra are stored in a more efficient way.
14.1.4. Psm CV parameters
Cv params are a key-value pairs list that allows to store additional information for a given psm. For example, it could be used to store the following, mzIdentML information:
-
'prot:FDR threshold': 0.01
-
number of unmatched peaks: 3
In quantms we use consensus_support where the value is the number of search engines that support the identification. This field could be added as an additional_score as: consensus_result: 3
The cv_params are stored as a list of key-value pairs, where the key is the name of the parameter, and the value is the value of the parameter. This is similar to the CVParams in the mzIdentML format. Please, be aware that search engine scores should be stored for psms in the column additional_scores.
14.1.5. Psm file metadata
For parquet psm files, the metadata of the file including quantms.io version and other metadata should be stored in the file. The metadata should be stored in the file as a key/value pair. The metadata should include the following fields:
-
quantmsio_version: The version of the quantms.io format used to generate the file. -
software_provider: The software provider and the version of the software used to generate the data. -
project_accession: The project accession in PRIDE Archive if available. -
project_title: The project title in PRIDE Archive if available. -
project_description: The project description in PRIDE Archive if available. -
scan_format: The format of the scan, with possible values:scan,index,nativeId,multiple. Multiple is used when multiple experiments are merged into one file. -
creator: Name of the tool or person who created the file. -
file_typeType of the file (psm_file) -
creation_date: Date when the file was created -
uuid: Unique identifier for the file -
compression_format: [gzip, snappy, lzo, none]
Example parquet in Python:
import pyarrow as pa
import pyarrow.parquet as pq

# Define a sample schema for the Parquet file
schema = pa.schema([
    ....
])

# Create sample data to write to the Parquet file
data = {
    ....
}

# Convert the data to a PyArrow Table
table = pa.table(data, schema=schema)

# Define the custom metadata as key-value pairs
file_metadata = {
    'quantmsio_version': '1.0',
    'software_provider': 'QuantMS 1.3.0',
    'project_accession': 'PXD012345',
    'project_title': 'Proteomics of Disease X',
    'project_description': 'Project description',
    'scan_format': 'scan',
    'creator': 'John Doe',
    'file_type': 'psm_file',
    'creation_date': '2021-01-01',
    'uuid': '943a8f02-0527-4528-b1a3-b96de99ebe75'
}

# Write the Parquet file with metadata
pq.write_table(table, 'psm_data.parquet', metadata=file_metadata)
Parquet files don’t have a specific limit for metadata size, but practical constraints exist based on your system’s memory, processing capabilities, and file management practices. The Parquet metadata, which is stored in the file’s footer, includes information like schema, column statistics, and data offsets. The metadata is loaded into memory when the file is read, so large metadata can impact performance. For large metadata, consider storing the metadata in a separate file or database and linking to it from the Parquet file.
14.1.6. Psm global q-value
The global q-value represents the q-value at the level of the experiment. In OpenMS this is the PSM q-value that is by default global at the level of the experiment and the run. In DIA-NN, it represents Global.Q.Value. At the run level, the Q.Value will be collected by additional_scores.
14.1.7. Format
The psm view can be found in psm.avsc.
14.2. Peptide feature view
The peptide feature view (peptide features) aims to cover detail on quantified peptide information level at the msrun level, including peptide intensity in relation to the msrun and sample metadata. The feature parquet file is a parquet file that contains the details of the peptides quantified in the experiment and sample.
The feature file is similar to the mztab peptide table, the peptide evidence in MaxQuant, the diann matrix table.
14.2.1. Feature use cases
-
Store peptide intensities in relation to the sample metadata to perform down-stream analysis and integration.
-
Enable peptide level statistics and algorithms to move from peptide level to protein level.
-
Different to the psm section Section 14.1 contains all the protein inference information depending on if protein inference was applied or not.
|
ℹ️
|
quantms also release the peptide table for MSstats. The goal of the feature table is to provide a more general peptide table and improve the annotations of the peptides with more columns. |
14.2.2. Feature fields
The following table presents the fields needed to describe each feature in quantms.io. Some of the fields are shared with the psm view (Section 14.1).
| Field | Description | Type | DIA-NN | FragPipe | MaxQuant | mzTab |
|---|---|---|---|---|---|---|
These fields are shared with features (Section 14.1) and peptides (Section 14.3) |
||||||
|
The peptide’s sequence (with no modifications) |
string |
Stripped.Sequence |
Peptide |
Sequence |
sequence |
|
Peptide sequence with modifications, see more Section 4.1 |
string |
Modified.Sequence |
Modified Peptide |
Modified sequence |
opt_global_cv_MS:1000889_peptidoform_sequence |
|
Modifications details: modification name, positions and localization probabilities: read Section 4.2 |
array[struct], null |
- |
- |
- |
- |
|
Precursor charge |
int32 |
Precursor.Charge |
- |
Charge |
charge |
|
Posterior error probability (PEP) for the given peptide or psm match. |
float32, null |
PEP |
x |
PEP |
opt_global_Posterior_Error_Probability_score |
|
Decoy indicator, 1 if the peptide is a decoy, 0 target |
int32 |
- |
- |
Reverse |
opt_global_cv_MS:1002217_decoy_peptide |
|
Theoretical peptide mass-to-charge ratio based on an identified sequence and modifications |
float32 |
- |
Calculated M/Z |
- |
calc_mass_to_charge |
|
Experimental peptide mass-to-charge ratio of identified peptide (in Da) |
float32 |
- |
- |
m/z |
exp_mass_to_charge |
|
Precursor retention time (in seconds) |
float32, null |
RT |
- |
Retention time |
retention_time |
|
Start of the retention time window for feature |
float, null |
RT.Start |
- |
- |
- |
|
End of the retention time window for feature |
float, null |
RT.Stop |
- |
- |
- |
|
Predicted retention time of the peptide (in seconds) |
float, null |
Predicted.RT |
- |
- |
- |
|
Ion mobility value for the precursor ion |
float, null |
- |
- |
- |
- |
|
start ion mobility value for the precursor ion |
float, null |
- |
- |
- |
- |
|
stop ion mobility value for the precursor ion |
float, null |
- |
- |
- |
- |
|
List of structures, each structure contains two fields: name and value. |
array[struct{name: string, value: float32}] |
DIA-NN Scores |
FragPipe Scores |
MaxQuant Scores |
search_engine_score |
|
Optional list of CV parameters for additional metadata Section 14.1.4 |
array[struct{cv_name:string, cv_value:string}], null |
- |
- |
- |
- |
Feature quantification and relation to the given reference file |
||||||
|
The intensity-based abundance of the feature in the reference file for different channels |
Precursor.Quantity |
Intensity |
Intensity |
Intensity |
|
|
The reference file name that contains the feature |
string |
Run |
- |
Raw file |
- |
|
Apart from the raw intensity, multiple intensity values can be provided as key-values pairs, for example, normalized intensity. |
|||||
Protein and protein groups information related to Section 15.1, Section 14.3 |
||||||
|
Protein group accession. Could be one single protein or multiple protein accessions, depending on the tool. |
array[string], null |
Protein.Group |
x |
Proteins |
accession |
|
One protein accession that represents the protein group |
string, null |
- |
- |
- |
- |
|
Unique peptide indicator, if the peptide maps to a single protein, the value is 1, otherwise 0 |
int32, null |
- |
Is Unique |
Unique |
unique |
|
Global q-value of the protein group at the experiment level |
float, null |
Global.PG.Q.Value |
- |
- |
best_search_engine_score |
|
Gene group accessions. |
array[string], null |
- |
- |
- |
- |
|
Gene names, as a string array |
array[string], null |
Genes |
- |
- |
- |
Spectra information |
||||||
|
The reference file containing the best psm that identified the feature. Note: This file can be different from the file that contains the feature ( |
string, null |
- |
- |
- |
- |
|
The scan number of the spectrum. The scan number or index of the spectrum in the file. |
string, null |
- |
- |
- |
|
|
ℹ️
|
|
14.2.3. Intensities
We capture intensity values for each feature or protein group on a given reference_file_name. The intensity data is structured into two complementary fields:
Primary Intensities (intensities)
The intensities field contains the primary/raw intensity measurements across different channels or samples. In label-free experiments, this is typically a single value per file, but in multiplexed experiments (TMT/iTRAQ) it contains multiple values - one for each channel. Each intensity entry contains:
-
sample_accession: Sample identifier (normally thesource namein the SDRF) -
channel: Channel identifier (e.g., "LFQ", "TMT126", "iTRAQ114") -
intensity: Raw intensity value
Example for TMT experiment:
intensities: [
  {sample_accession: "Sample-1", channel: "TMT126", intensity: 1234.1},
  {sample_accession: "Sample-2", channel: "TMT127C", intensity: 5678.2}
]
Example for LFQ experiment:
intensities: [
  {sample_accession: "Sample-1", channel: "LFQ", intensity: 9876.5}
]
Additional Intensities (additional_intensities)
The additional_intensities field contains derived/processed intensity values that are calculated from the primary intensities using different algorithms or normalization methods. Each entry contains the same sample and channel information plus an array of named intensity types:
-
sample_accession: Sample identifier (matches primary intensities) -
channel: Channel identifier (matches primary intensities) -
intensities: Array of intensity types with names and values
Example:
additional_intensities: [
  {
    sample_accession: "Sample-1",
    channel: "LFQ",
    intensities: [
      {intensity_name: "normalize_intensity", intensity_value: 0.1234},
      {intensity_name: "lfq", intensity_value: 2345.6},
      {intensity_name: "ibaq", intensity_value: 4567.8}
    ]
  }
]
Semantic Guidelines
-
Use
intensitiesfor: Raw/primary measurements, different experimental channels (TMT/iTRAQ tags), different samples -
Use
additional_intensitiesfor: Normalized values, LFQ intensities, iBAQ values, algorithm-specific processed intensities
This design separates experimental design aspects (channels/samples) from data processing aspects (normalization/algorithms), providing clear semantics for both data producers and consumers.
14.2.4. DIANN scan
The DIA-NN scan is a string that contains the scan number of the MS2 used to identify the peptide. We use the rt field and the mzML information to get that number.
14.2.5. Format
The feature view can be found in feature.avsc.
14.3. Peptide summary view
The peptide summary view aims to cover detail on peptides quantified in the experiment and sample. A peptide could be a modified peptide (sequence with modifications) or non-modified peptide (sequence with no modifications) depending on the use case and the granularity of the data. The peptide view is a tab-delimited file format that claims to represent the peptides quantified in the experiment.
14.3.1. Peptide use cases
-
It serves as a report file with all peptides quantified in the experiment for each protein.
-
It can be used to generate peptide reports for integration with tools and services.
14.3.2. Peptide fields
Some of the fields are shared between the Section 14.1 and Section 14.2 views.
| Field | Description | Type |
|---|---|---|
These fields are shared with features (Section 14.2) and peptides (Section 14.1) |
||
|
The peptide’s sequence (with no modifications) |
string |
|
Peptide sequence with modifications, see more Section 4.1 |
string |
|
Modifications details: modification name, positions and localization probabilities: read Section 4.2 |
array[struct], null |
|
Gene group accessions. |
array[string], null |
|
Gene names, as a string array |
array[string], null |
|
The best search engine score from all the features/psms identified |
array[struct[name: string, value:float32]], null |
|
The sample accession in the SDRF, which column is called |
string, null |
|
The peptide abundance in the given sample accession |
float32, null |
14.3.3. Format
The peptide view can be found in peptide.avsc.
15. Protein views: Protein groups and Protein summary
We have two main reports for protein information.
-
The Section 15.1 report is the output of the quantitative tool including quantms, MaxQuant or DIA-NN.
-
The Chapter 16 is a protein summary is a summary of the protein quantified by samples.
15.1. Protein group view
The protein group view is a tabular file that contains the details of the protein groups identified and quantified. The protein group is similar to the outputs of multiple tools such as MaxQuant, DIA-NN, and others.
The file defines the relation between a protein groups and the raw file that contains the protein group. The protein group view is a key file in the proteomics data analysis workflow as it describes the protein groups identified and quantified in the experiment.
15.1.1. Protein group use cases
-
Retrieve all the protein groups identified or quantified in the file.
-
Compute the protein group abundance by file and condition.
-
Store information about FDR and q-values for the protein groups identified/quantified.
15.1.2. Protein group fields
| Field | Description | Type | DIA-NN | FragPipe | MaxQuant |
|---|---|---|---|---|---|
|
Protein group accessions of all the proteins within this group |
array[string] |
Protein.Group |
Group + Indistinguishable Proteins |
Protein IDs |
|
Protein group names |
array[string] |
Protein.Names |
- |
Protein names |
|
Gene group accessions, as a string array |
array[string] |
Genes |
- |
Gene names |
|
The raw file containing the identified/quantified protein |
string |
Run |
- |
combined |
|
Peptide sequence counts for this protein group in this specific file. Contains unique sequences (specific to this protein group) and total sequences. |
struct |
Unique.Stripped.Peptides |
Unique Peptides |
Unique peptides |
|
Peptide feature counts (peptide charge combinations) for this protein group in this specific file. Contains unique features (specific to this protein group) and total features. |
struct |
Precursor.Quantity |
Precursor Ions |
MS/MS count |
global_qvalue |
Global q-value of the protein group at the experiment level |
float |
Global.PG.Q.Value |
- |
Q-value |
|
The primary intensity-based abundance of the protein group in the sample across different channels. Contains raw/primary measurements from the quantification tool. |
PG.Quantity |
- |
Intensity, LFQ intensity |
|
|
Derived/processed intensity values calculated from primary intensities using different algorithms (normalization, LFQ, iBAQ, etc.). |
PG.Normalised, PG.MaxLFQ |
- |
LFQ intensity, iBAQ |
|
|
Number of peptides per protein in the protein group |
array[struct] |
- |
- |
Razor + unique peptides, Unique peptides |
|
Representative protein of the protein group (usually the first) |
string |
- |
- |
First protein in Protein IDs |
|
Decoy indicator |
int32 |
- |
- |
Reverse |
|
Contaminant indicator |
int32 |
- |
- |
Potential contaminant |
|
Additional scores and metrics |
array[struct] |
- |
- |
Score, Sequence coverage [%], Mol. weight [kDa], MS/MS count |
15.1.3. protein additional scores
At the protein level, additional scores should be store for each given protein group. The additional scores are stored as a list of key-value pairs, where the key is the name of the score (is RECOMMENDED to use HUPO-PSI MS ontology) and the value is an array of float32 values where the index of values matches to the index on the pg_accessions field. Additional scores are mainly the search engine and protein scores that want to be added at the protein group level.
16. Protein view
The protein view is a report of the proteins identified/quantified in the experiment. It doesn’t contain major information about the inference of the protein group, but it contains the protein abundance and the protein identification scores.
16.1. Use cases
-
Fast reports of the proteins quantified/identified in an experiment with for Web interfaces and search engines.
-
Connection to AE/DE formats that enable to talk about the coverage of the protein identification.
| Field | Description | Type |
|---|---|---|
|
Abundance of the given protein in the sample/experiment |
null, float |
|
Sample accession in the SDRF, which column is called |
string |
|
The best search engine score for the identification |
|
|
The gene accessions corresponding to every protein |
null, array[string] |
|
The gene names corresponding to every protein |
null, array[string] |
|
The total number of peptides for a give protein |
null, integer |
|
The total number of peptide spectrum matches |
null, integer |
|
The total number of unique peptides |
null, integer |
16.1.1. Format
The protein view can be found in protein.avsc.
17. Mass spectra view
The mass spectra view is a tabular file that contains the details of the mass spectra identified and quantified. This view is based on mz_parquet format developed by Michael Lazear. The mz_parquet format is a parquet-based format that stores the mass spectra information in a columnar format.
17.1. Mass spectra use cases
-
Retrieve all the precursor mass, retention time, and intensity in the file.
-
Enable easy visualization and scanning on mass spectra level.
-
AI/ML training and prediction on mass spectra level.
17.2. Mass spectra fields
| Field | Type | Description |
|---|